

What we are working on this week
In this week’s video, we discuss why the rally we have seen in markets is probably driven by liquidity trends as much as anything else. Andrew believes the Federal Reserve added liquidity to prevent issues in funding markets and higher yields in the lead-up to the year end (historically a sensitive time for the global financial plumbing which has become the Fed’s de facto responsibility). Banks were expected to hoard extra liquidity but instead expanded balance sheets aggressively, contributing to the rally. Andrew thinks the Fed will take liquidity back out of the system in January.
Intriguingly he now, tentatively, thinks the economic outlook may be stronger than perceived in Asia, which could be a boon to the Australian economy. More generally, this adds to the sense that inflation could return in H2 2023. In Australia, the RBA wants households to capitulate on spending to reduce inflationary pressures but the population, overall, seems to remain optimistic on growth and might prove more difficult to rein in. The RBA looks to be the only central bank focused on tackling high asset prices and over-reliance on credit to spur productivity. We will probably catch up with him again briefly in the run-up to Christmas to assess financial liquidity conditions, but he expects a reassessment of growth by investors as economic data weakens earlier in the new year and potentially bond yield reversal in January. With that in mind, we expect that to be the next landmark as far as portfolio positioning is concerned and are adopting a fairly neutral stance in the interim. It is early days for this thesis but we are mindful that almost a year ago Andrew's very contrarian call that the China reopening trade was going to be a damp squib proved to be spot on.
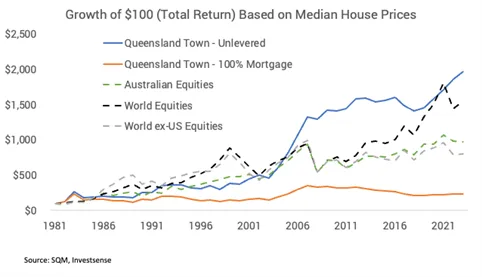
We have made some progress on an analytical project we have been doing that attempts to put the past performance and prospects for residential property investment in the same context as our Valuation Dashboard and multi-asset portfolio returns. There are quite a few nuances to work through including leverage, negative gearing and so on, but the following graphs demonstrate some of the output that we have come up with so far. This is based on a property that has been bought outright in a large rural Queensland town which has, on average yielded a 4% gross rental yield with a 3% carrying cost. At the other end of the spectrum, we show a version which is perpetually negatively geared with average interest rates of 8%. These are extremes but perhaps not wholly unrealistic these days.
It is often said that residential property investment can be a very local affair and if you would like to work with us to produce something similar for the area that your clients may live or invest in, please let us know. We’d also like to work with you to model some more common financing scenarios, so don’t hesitate to reach out. Despite these differences in locale, there are also some interesting generalisations that can be inferred, and we will aim to write up a white paper on this early in the new year.